Hot Summer days in the first week of Spring —
time to update every disaster plan, from your household to Congress
By RB Sydney, MS —
Science Writer and Analyst, Northern California — April 2026 — Organize the Future
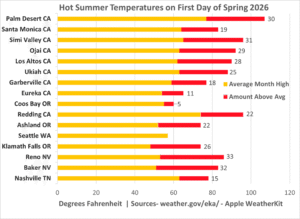
Do you remember thinking — this heat is not right, it’s only March? A ten-day heatwave peaked on the first day of spring, March 20, 2026. The entire Continental U.S. (CONUS) was not experiencing summer-like warmth — it was experiencing hot summer temperatures, with some locations recording highs more than 30°F above seasonal norms.
The short-term impacts of that heatwave are still unfolding — and the longer-term implications are a reason for full scale engagement and sustained focus on mitigating the damage.
This is based on real-time weather data that almost everyone experienced firsthand. The question now is whether our plans — at every level — are built to handle whatever extreme weather is coming.
The super-fires in California have shown just what happens when plans are not updated for current conditions. None of that planning anticipated super-fires becoming epidemic, nor the possibility of two major fires burning simultaneously in one fire management area like Los Angeles.
Outdated water management plans have even farther-reaching consequences. The management of the Colorado River has been out of sync with changing realities for decades and that will come home to roost, possibly this year.
The Data Behind the Events
The facts driving this concern show just how the weather is acting way beyond previous norms.
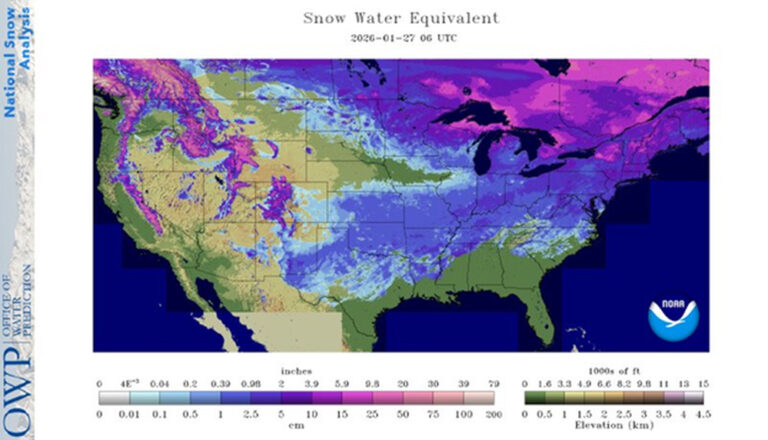
The West was already facing an almost complete absence of snow when a “Snow Drought” was declared from Colorado to the Pacific Coast.
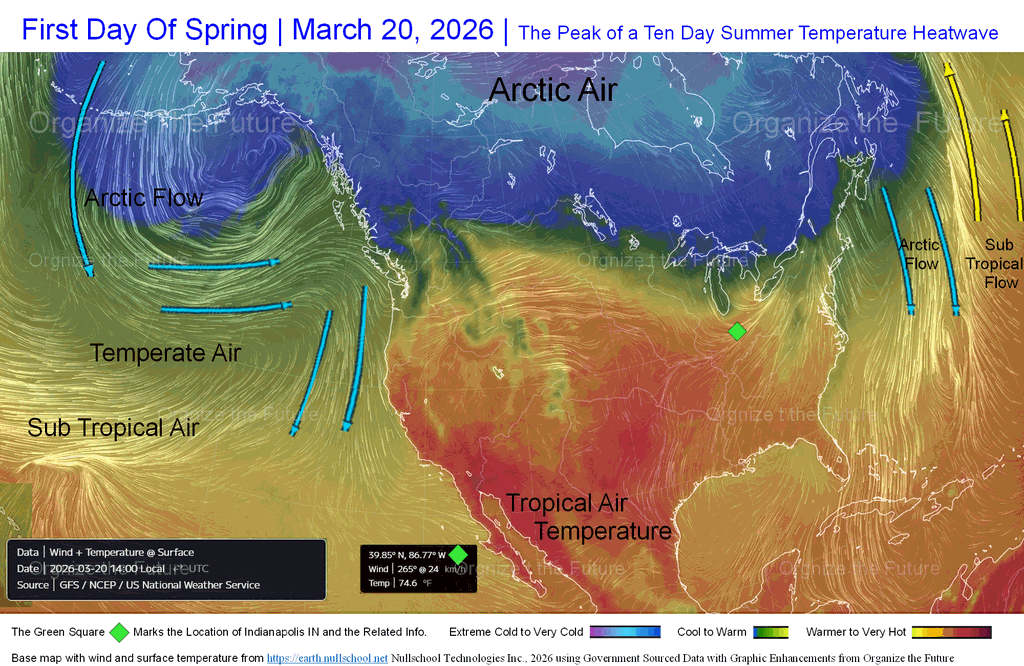
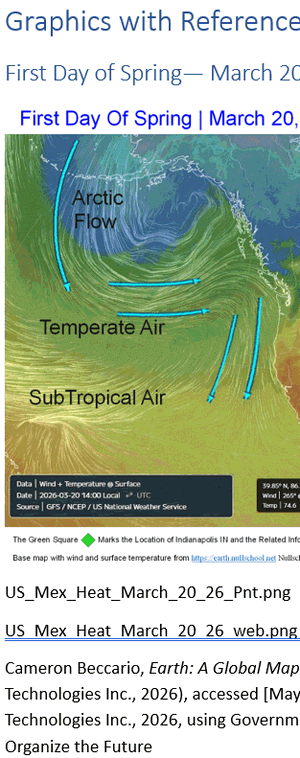
The temperature bar graph and map together show how completely the heat covered the CONUS with hot enough weather to start melting snow and ice pretty much everywhere.

The snow cover bar graphic shows 35% of CONUS covered with snow before the March heat and only 5% being covered by month end. By the end of April, NOAA reports indicate it was just under 2% snow cover; a “snow drought” over the CONUS.
The national drought predictions support that, indicating 61% of the country was under drought conditions.
The severity of drought risks is tracked and measured using the Palmer Drought Indexes developed in the sixties. These have been used and refined with a proven track record and applied to 132 years of historic records. The risk of drought gets more severe as the index drops below zero.
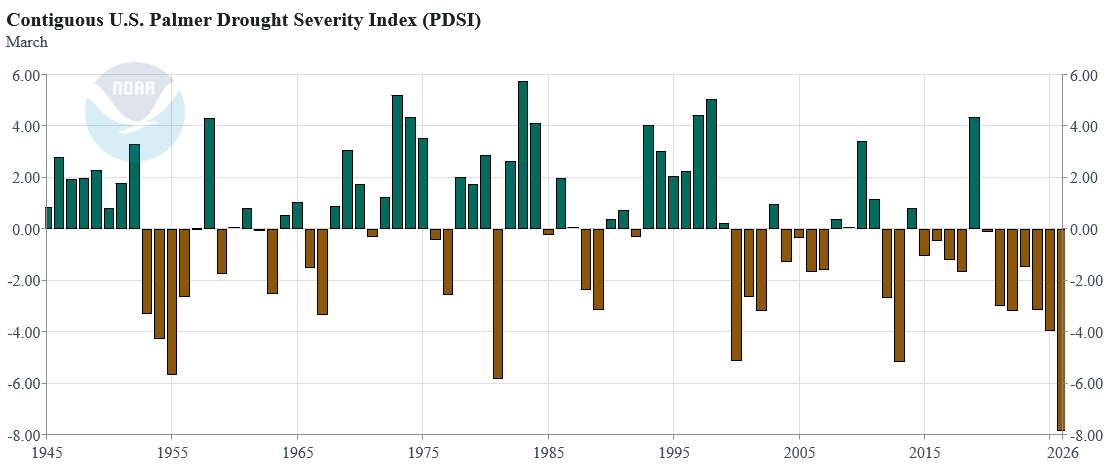
The negative risk factor of -7.56 for this April ranks as the number one strongest risk for the 132 years of data. There are only two other years that stand out. One is 1934 at -5.95 that was the start of the 4 years of the “Dust Bowl” agricultural disaster. The other was 1981 at -5.98 which was a stand-alone drought year.
The year 2021 was pivotal for billion-dollar weather disasters and was the start of five years of strong drought risks in March (-3.17, -2.68, -1.41, -2.77, -3.49). These covered smaller areas so they are dwarfed by this year’s -7.56 risk factor that covers over 60% of CONUS, per the NOAA March weather reports.
But there is another significant event unfolding. The map shows tropical temperatures reaching up from Florida and the Gulf Coast. A larger map would show those temperatures coming up from South America where tropical weather is typical. That is where the hot air connects with the hot water —where the “Super El Niño” is developing.
“El Niño’s” have a long history of severely compromising water supplies and agriculture. The “Super” ones although less frequent, have more severe impacts including droughts, torrential rain and flooding’
My certified mastery of international agricultural sciences conferred by UC Davis makes these consequences this all too familiar. The level of drought predicted leads to fires, crop losses and water shortages that becomes food insecurity and water insecurity in a short time frame.
big picture consequences
Having these two anomalous weather events developing at the same time is unprecedented with no way to know what will happen. The Palmer Severe Drought Index may prove correct and El Niño could make that worse, or El Niño flooding may wash some part of the drought away — but which part? The early developments seem to be doing just that.
All of this is intense weather with extreme potential impacts and all of it has become unpredictable. The conflict between two histories shows why these massive weather events point to a serious need to address agricultural planning, crop disaster preparations and the impacts of compromised food security — not just for our people but potentially globally.
The spring heatwave was not an isolated event. It was the opening chapter of a sequence — drought, fire, crop stress, water competition — that will define much of 2026 and beyond.
We cannot change what March brought. We can change how prepared we are for what comes next. Updated disaster plans. Fire management. Realistic water management. Agricultural contingency at every scale.
The facts are clear. The preparation starts now — at home, in every community, and at every level of government — held accountable by our vote.
About the Author
RB Sydney is a science writer and analyst in Northern California. He holds an M.S. in International Agricultural Development from UC Davis and a B.A. in Biological Science, with 50 years of real-world experience in applied sciences and tracking bio-regional conditions across North America since 1972. His analytical work was published by the California Governor’s Office and by nonprofit publications including the North Coast Environmental Center. He authored several books, including Energy and EV Secrets
Authors Notes
Author’s Note — AP Style Exceptions and Editorial Decisions
- CONUS — Acronym defined on first use and used consistently thereafter. Intentional for Science Lane register.
- Super El Niño — Capitalization and hyphenation follows NOAA convention. Used consistently throughout.
- Palmer Drought Indexes — Plural form confirmed against NOAA house style.
- Super-fires — Hyphenated form used consistently throughout. Intentional compound modifier.
- Rhetorical question lede — Intentional stylistic departure from hard news lede convention. Chosen to activate shared reader experience before presenting data, consistent with publication’s felt-experience-to-solution editorial arc.
- Billion-dollar weather disasters — Aligned to NOAA lowercase hyphenated style.
- “Held accountable by our vote” — Intentional civic register choice in closing. Non-partisan civic accountability language consistent with publication’s editorial standards.
- Temperature anomaly data sourcing — The 30°F above seasonal norms figure is observational field data collected March 20, 2026 from Apple Weather App (WeatherKit), which distributes reports from National Weather Service/NOAA and The Weather Channel (Weather Company LLC), as documented at https://support.apple.com/en-us/105038. Data was cross-checked against www.weather.gov/eka/. This data carries the standard of reputable science-based consumer weather reporting, consistent with op-ed sourcing conventions
Editorial Categories
Weather,
Economy & Business,
Environment,
Politics & Government,
Natural Disasters,
Hot Summer days in the first week of Spring
This Op Ed comes with resources to make it easy to
use this for different purposes
Everything you need to use this Op Ed is available for the asking. All we ask is your contact info to track who is using this work. Organize the Future is a volunteer effort as a work of love for our people, our country and the planet we call home. Just use the buttons below to get just what you need. The full submission package has it all while the other buttons deliver only what you want. Then there is a bonus of a larger bibliography to support your interest and your work.
One Package that covers it All
This package provides:
Full op-ed copy,
Author bio block,
Author head-shot,
Supporting data/stats,
Data visualizations,
Source citation list,
Plain Text version,
Rights & usage Statement,
What any type of news outlet would need to publish this Op-Ed.
Lists and links for the Article
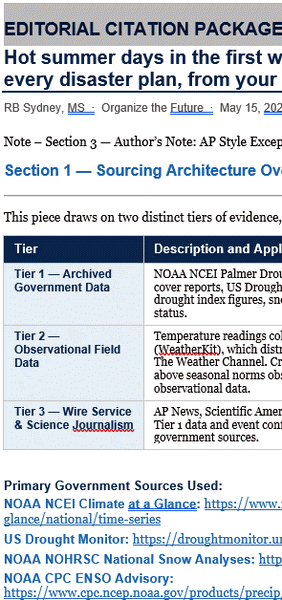
The graphic shows the layout of the article bibliography. There is also a standard list of references for the article with active links,
There is a bonus below will also provide you with a far larger Bibliography for researching Extreme Weather.
Graphics galore with Citations.
This documents the graphics in the article are with references and the data used to generate the images. . Images are copy and paste versions for the web. Links for both print and web versions are included.

RB Sydney’s Background in Detail
There are different Standard Biographs suitable for various purposes. The get to know the author story is primarily to encourage confidence in his thinking and approach to life.
Plus an extensive, searchable and annotated Extreme Weather Bibliography far beyond the Scope of the Article
This is updated periodically and available anytime and the link to download is also part of the Full Submission Package.
The layout of the full Extreme Weather Bibliography is like the one above only there a far more entries in various categories. It is a feast of data for writers and editors who need solid facts.
the primary article References
full links in the op-ed Package
Cameron Beccario, Earth: A Global Map of Wind, Weather, and Ocean Conditions (Nullschool Technologies Inc., 2026), accessed May 11, 2026, https://earth.nullschool.net

NOAA National Centers for Environmental Information, Climate at a Glance: National Time Series, published May 2026, retrieved May 11, 2026, https://www.ncei.noaa.gov/access/monitoring/climate-at-a-glance/national/time-series

NOAA National Centers for Environmental Information, Climate at a Glance: National Mapping, published May 2026, retrieved May 11, 2026, https://www.ncei.noaa.gov/access/monitoring/climate-at-a-glance/national/mapping