
The Heat Came First.Texas Can See What’s Next.
You don’t have to agree on why — to agree on what.
By RB Sydney · Science Writer and Analyst, Northern California · Sept. 2026
Extreme Heat Warnings across Texas — is this recent heatwave a business-as-usual condition or something more extreme? What the warnings do mean is conditions were above the threshold that puts people in real danger. That makes this a life-or-death situation.
It seems counterproductive that weather has turned into a political issue with all sorts of divisive ideas and abuse about our views. Another option is working together and adapting to the measured results. That is important as this could go on for a long time or change within a few days — as it already did. Adapting with resilience is a way to manage our lives better without taking any of it personally. Weather just is.
Typical or extreme
The basic temperature data from automated weather stations is clear but it is less obvious whether that temperature is typical or extreme at any time of year or location.
That is where the 30-year daily temperature running averages come into play. Simply averaging daily numbers from the nearest weather stations over 30 years makes a math statement of how many degrees the current temperature is above or below normal.
The National Weather Service (NWS) and Apple Weather showed 3 to 5 degrees above average for three Texas cities in the second week of August. By Aug. 23 and 24, Apple Weather data showed Austin and Houston above the 30-year average daily maximum by 7 to 8 degrees and Dallas by 10 to 11 degrees — roughly double the earlier readings, with Dallas at 105 and 106 degrees.
Temperature is only one measurement a smartphone feed like Apple Weather carries. Another is humidity, measured as dew point, which drives the Heat Index.
When does 93 equal 108? When the dew point is in the 60s and 70s that correlates to discomfort and distress and relates to a higher Heat Index as it did on Friday, Aug. 14.
| City | Daily high | NWS heat index | Alert status |
| Houston | 93°F | 102–112 | NWS Houston/Galveston hazard message |
| Austin | 97°F | up to 109 | Point forecast |
Here is what Houston looked like the Sunday, Aug. 16, two days later.
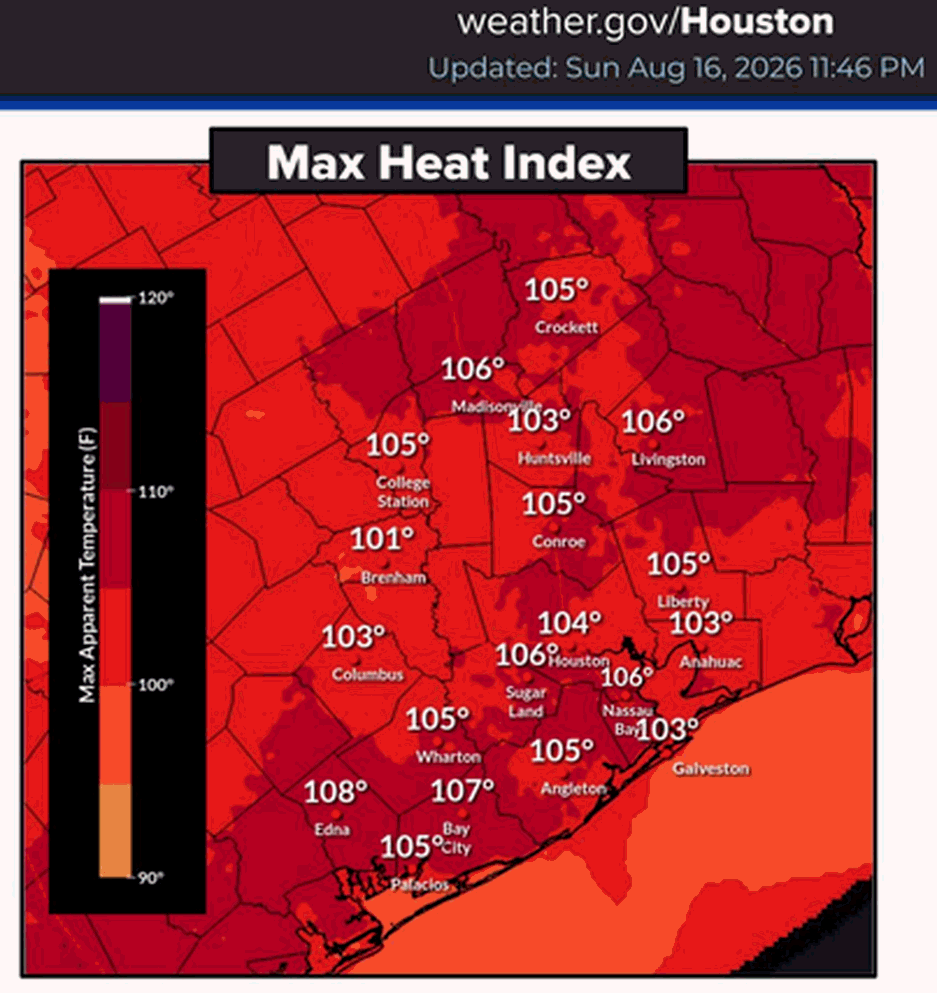
By the end of the third week the NWS temperature in Austin was at 105 degrees and Houston was at 100 degrees with correspondingly higher heat indexes. That is how Heat Indexes move into the Extreme Heat Warning territory when the impacts on all living things turn serious.
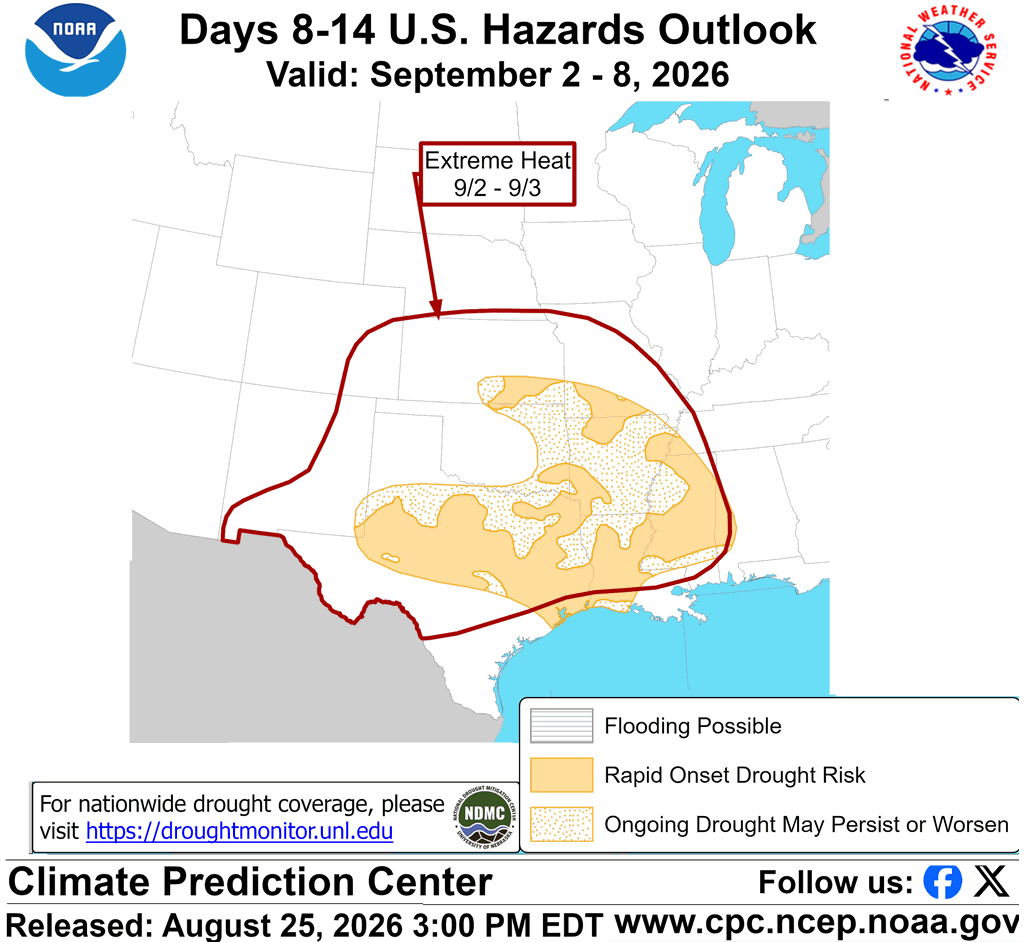
There is a NOAA Climate Prediction Center (CPC) prediction that the combined heat and humidity will last two more weeks going into September. Every high-risk day in a row increases the risk of heat stroke or worse.
Where this goes
One part of this does not add up. Houston and Austin showed high humidity with little chance of rain. The moisture must be coming from somewhere else. Earth.nullschool.net shows a tropical air mass pushing hot, humid surface air up from the Gulf and northern Mexico. Tropical air usually brings rain. There is almost none in that picture.
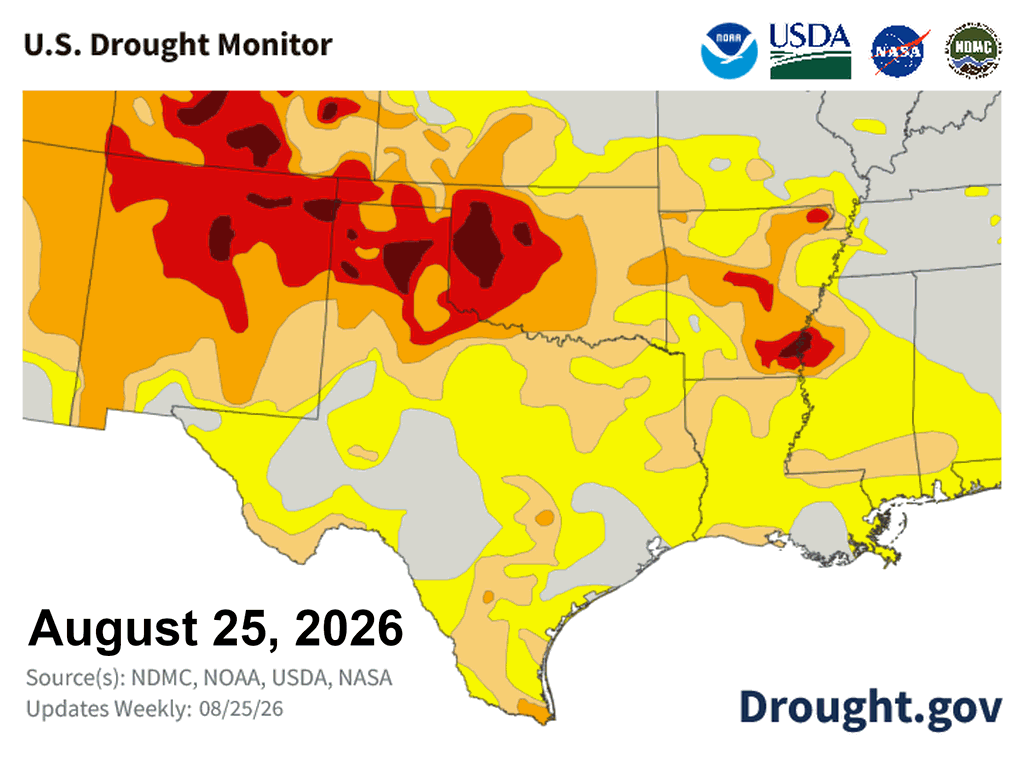
The website Drought.gov shows that central Texas is in a widespread drought. The drought is not coming. It is here.
Drought.gov showed Texas on Aug. 11 with 27.9% of Texas in mostly moderate drought and just under another 30% being “Abnormally Dry.” Two weeks later the following table for Aug. 25 shows drought had spread with increased intensity.
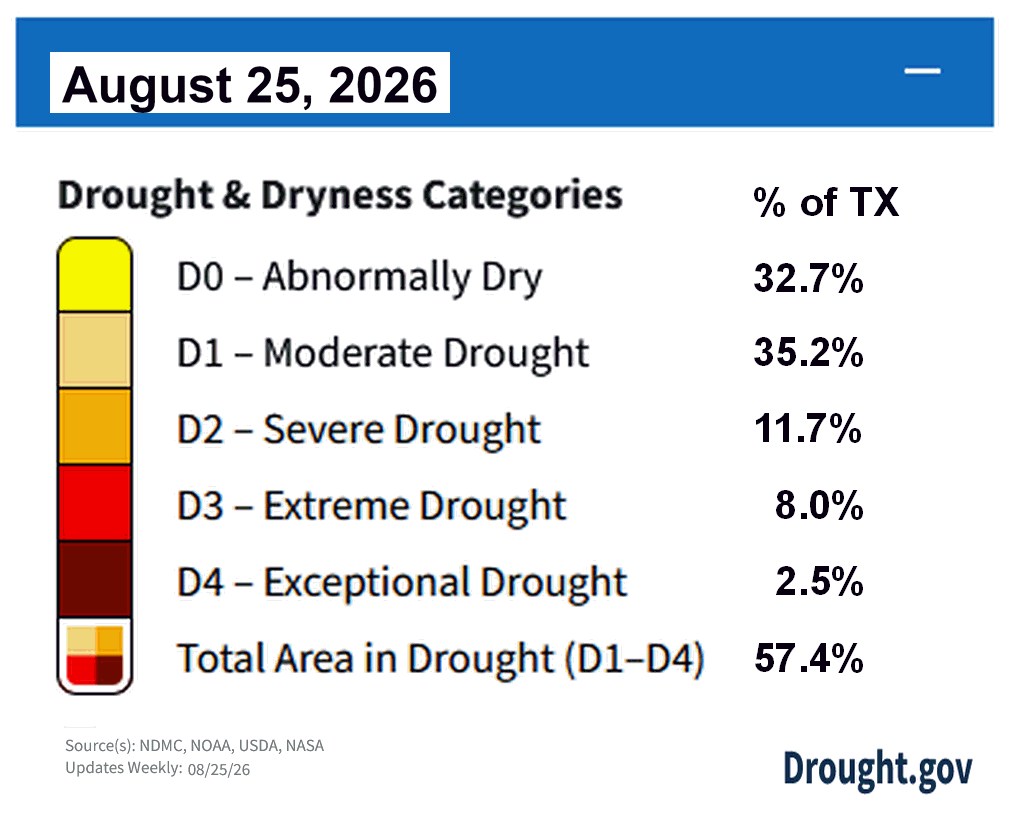
The map connected to this table showed this happening over a large area.
The NOAA CPC table for Aug. 25 shows most of the recent Abnormally Dry areas (“D0” at over 33% of the state) succumbing to the Rapid Onset Drought.
The Texas drought this year goes back to the unseasonable heat wave in March when 98.8% of the state was abnormally dry or in drought with a Drought Severity and Coverage Index of 285 (DSCI — possible values from 0 to 500). In less than four months on July 31, the covered area was below 40% and the DSCI at 72, which would have sounded really good.
Just over three weeks later, on Aug. 25, the coverage was up at 90% again with a DSCI of 183. That describes a Rapid Onset Drought as predicted by the CPC with a high risk of more into mid-September.
weather as usual!
The arrival of Tropical Storm/Depression Edouard in Houston with potential flooding may forestall the drought development. Then there is El Niño. That adds even more unpredictability to the situation. This looks more like a wild rodeo ride than weather as usual.
This shared chaos is hitting people with a reputation for being tough and knowing how to work together. Having been to every state, if anyplace can handle and adapt to this it would be Texas. This crazy extreme weather is something to look square in the eye, set aside your differences and get everyone, especially your elected officials, to do what needs to be done.
About the Author
RB Sydney is a science writer and analyst in Northern California. He holds an M.S. in International Agricultural Development from UC Davis and a B.A. in Biological Science, and has tracked bio-regional conditions across North America since 1972. His analytical work has been published by the California Governor’s Office and by nonprofit publications including the North Coast Environmental Center. He wrote “History of the Farmers Markets” and has spent decades on drought and extreme weather in the field.
Authors Notes
Authors Notes are available with the resources below
The series description
This piece is part of a developing four-stage civic framework — Organize the Future · Claim the Future — that moves from documented reality through civic obligation and common ground to practical action, using facts, reason, and the principles of nonviolent communication.
Where Partisans Agree is the framework’s third stage. Each piece identifies where evidence points the same direction from both sides of a political divide, and builds the argument from that shared ground. When a piece names an adversary it names a behavior, never a party or a person, and the closing frames action as agreement rather than compromise.
The Heat Came First. Texas Can See What’s Next
This Op Ed comes with resources to make it easy to
use this for different purposes
Everything you need to use this Op Ed is available for the asking. All we ask is your contact info to track who is using this work. Organize the Future is a volunteer effort as a work of love for our people, our country and the planet we call home. Just use the buttons below to get just what you need. The full submission package has all the basics while the other buttons deliver more of what you may want.
One Package that covers it All
This package provides:
Full op-ed copy,
Author bio block,
Embedded Graphics with Web resolution
Author head-shot,
Plain Text version,
Supporting data/stats,
Data visualizations,
Source citation list,
Rights & usage information,
The basics for any type of news outlet would need to publish this Op-Ed.
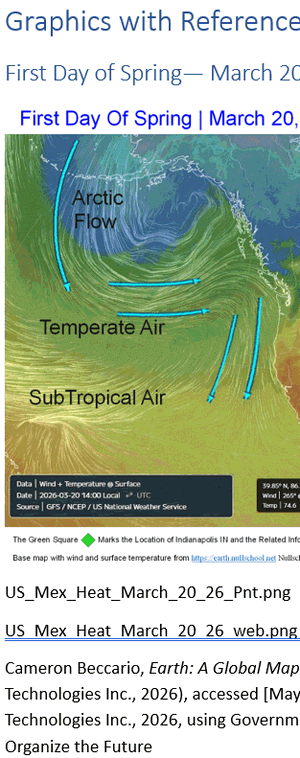
Graphics galore with Citations.
This documents the graphics in the article are with references and the data used to generate the images. . Images are copy and paste versions for the web. Links for both print and web versions are included.
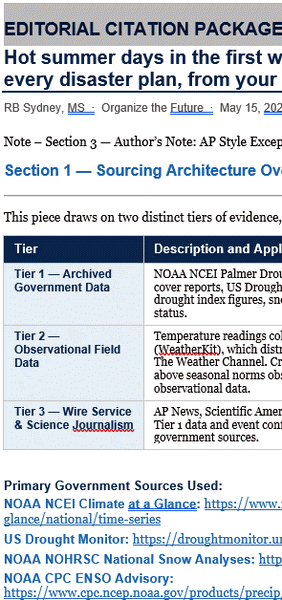
Lists and links for the Article
The graphic shows the layout of the article bibliography. There is also a standard list of references for the article with active links, A sample of the Citations is below.
Extreme Weather.

RB Sydney’s Background in Detail
There are different Standard Biographs suitable for various purposes. The get to know the author story is primarily to encourage confidence in his thinking and approach to life.
Rights and Usage Statement
Organize the Future · Claim the Future Standard rights and usage language for op-ed distribution are available in two variants — Simultaneous / Non-Exclusive is typical and Exclusive (First Serial) Offering is possible upon request
the primary article References
Extracted from the Editorial Citation Package
Here is a sample of bibliographic info for the primary sources used and a sample of the one of the 19 point by point citations with full links. The full Editorial Citation Package is included separately from the links above.
The Heat Came First. Texas Can See What’s Next.
RB Sydney, MS · Organize the Future · August 2026 · Tier 2 Regional · Where Partisans Agree Lane
Citation style: Chicago Author-Date throughout. · Built: 2026-08-31
Primary sources used
- US Drought Monitor: https://droughtmonitor.unl.edu/
- US Drought Monitor Map Archive: https://droughtmonitor.unl.edu/Maps/MapArchive.aspx
- US Drought Monitor weekly statistics tables: https://droughtmonitor.unl.edu/DmData/DataTables.aspx
- Drought Severity and Coverage Index documentation: https://droughtmonitor.unl.edu/About/AbouttheData/DSCI.aspx
- NIDIS Drought.gov — Texas: https://www.drought.gov/states/texas
- NIDIS Rapid Onset Drought: https://www.drought.gov/data-maps-tools/day-8-14-us-hazards-outlook-rapid-onset-drought
- NOAA CPC US Hazards Outlook: https://www.cpc.ncep.noaa.gov/products/predictions/threats/threats.php
- NOAA NCEI US Climate Normals, 1991–2020: https://www.ncei.noaa.gov/products/land-based-station/us-climate-normals
- NWS Extreme Heat product renaming notice: https://www.weather.gov/news/250310-heat-hazard
- NWS Heat Watches, Warnings and Advisories: https://www.weather.gov/safety/heat-ww
- NWS Heat Index: https://www.weather.gov/safety/heat-index
- NWS Houston/Galveston (HGX): https://www.weather.gov/hgx
- NWS Austin/San Antonio (EWX): https://www.weather.gov/ewx
- NWS Fort Worth/Dallas (FWD): https://www.weather.gov/fwd
- Apple WeatherKit data sources: https://support.apple.com/en-us/105038
- Earth: A Global Map of Wind, Weather, and Ocean Conditions: https://earth.nullschool.net
Sourcing Architecture Overview
This piece draws on three tiers of evidence, each appropriate to the claims it supports.
| Tier | Description and application |
| Tier 1 — Archived Government Data | US Drought Monitor archived maps and weekly statistics tables, NOAA NCEI US Climate Normals (1991–2020), National Drought Mitigation Center index documentation, NWS service notices. Used for all drought coverage figures, DSCI values, 30-year baselines, and product terminology. |
| Tier 2 — Observational and Operational Data | NWS operational products — heat index values as issued in advisories and point forecasts, Climate Prediction Center hazards outlooks, and current-conditions monitoring portals. Temperature readings collected via Apple Weather App (WeatherKit), which distributes National Weather Service/NOAA and Weather Company reports, cross-checked against weather.gov. Standard op-ed sourcing convention for real-time observational data. |
| Tier 3 — Interactive Visualization | Earth: A Global Map of Wind, Weather, and Ocean Conditions, used for the atmospheric moisture-transport observation and cited to the specific dated view. |
Section 2 — Statement-by-Statement Citations
Each statement below is quoted as it appears in the manuscript, followed by the supporting citation, source type, tier, and verification URL. The full list of 19 statements appear in article order.
1. Extreme Heat Warnings across Texas.
| Citation | National Weather Service. 2025. “NWS Updates Heat Products for 2025.” Published March 10, 2025. |
| Source Type | Government agency notice — NOAA National Weather Service |
| Tier | 1 |
| URL | https://www.weather.gov/news/250310-heat-hazard |
| Supporting detail | Effective March 4, 2025, Excessive Heat Watches were renamed Extreme Heat Watches and Excessive Heat Warnings were renamed Extreme Heat Warnings, under the NWS Hazard Simplification Project. The term used in the manuscript is the current formal product name. |
